Project management has evolved dramatically over the past decade, but in 2026 one tool continues to stand out as a cornerstone of successful planning and execution: the Gantt chart.
Once viewed as a simple scheduling diagram, the modern Gantt chart has become a dynamic and intelligent project management system that helps businesses coordinate teams, predict delays, manage resources, and improve productivity. With remote work, artificial intelligence, and global collaboration now standard across many industries, Gantt charts are playing a more important role than ever before.
What Is a Gantt Chart?
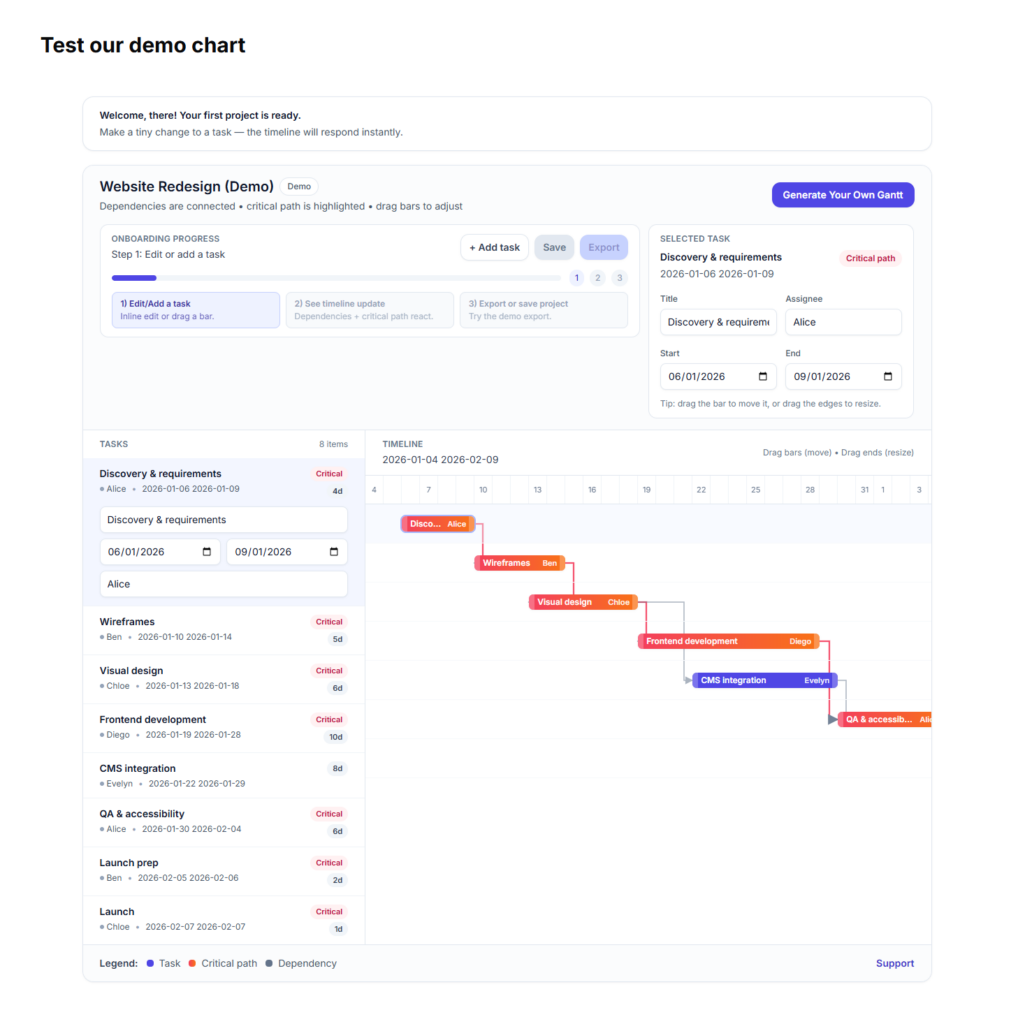
A Gantt chart is a visual timeline used to plan and track project tasks over a specific period. It displays activities as horizontal bars across a calendar, showing when tasks begin, how long they last, and how they relate to one another.
Traditionally, Gantt charts were used mainly in construction and engineering. Today, they are used in almost every industry, including:
- Software development
- Marketing
- Healthcare
- Finance
- Manufacturing
- Education
- Event planning
Modern digital platforms have transformed the once static chart into a live collaboration hub.
Why Gantt Charts Matter More in 2026
The workplace of 2026 is faster, more connected, and increasingly complex. Businesses often manage teams spread across multiple countries and time zones, while projects involve dozens of moving parts and tight deadlines.
Gantt charts help bring structure to that complexity.
They allow managers and teams to see the entire project at a glance, making it easier to understand priorities, identify risks, and maintain momentum.
In an era where efficiency is everything, visual clarity has become a competitive advantage.
The Rise of AI Powered Gantt Charts
One of the biggest developments in recent years has been the integration of artificial intelligence into project management tools.
AI powered Gantt charts can now:
- Predict scheduling conflicts
- Suggest task priorities
- Automatically adjust timelines
- Forecast resource shortages
- Identify potential delays before they happen
- Recommend workflow improvements
Instead of simply displaying information, modern systems actively help teams make better decisions.
For example, if a critical task begins slipping behind schedule, the software may automatically recommend reallocating staff or extending dependent deadlines to avoid project failure.
This predictive capability is changing how organisations manage risk.
Better Collaboration for Remote Teams
Remote and hybrid working are now permanent features of modern business. While this flexibility offers many benefits, it also creates communication challenges.
Gantt charts help solve these issues by providing a shared visual roadmap that everyone can access in real time.
Team members can instantly see:
- Current project status
- Upcoming deadlines
- Task ownership
- Dependencies between departments
- Progress updates
This reduces confusion and helps prevent duplicated work or missed responsibilities.
In 2026, many project management platforms also include live commenting, file sharing, and automated notifications directly within the Gantt chart interface.
Improved Resource Management
Managing workloads effectively has become a major concern for businesses trying to avoid burnout and maintain productivity.
Modern Gantt charts now provide advanced resource tracking features that allow managers to see exactly who is overloaded and who has spare capacity.
This creates more balanced workloads and helps companies use staff time more efficiently.
Some systems even calculate productivity trends and recommend staffing adjustments based on historical project data.
Increased Transparency and Accountability
One reason Gantt charts remain so effective is their transparency.
Everyone involved in a project can clearly see:
- What needs to be done
- Who is responsible
- When tasks are due
- Which activities are causing delays
This visibility encourages accountability while reducing misunderstandings between teams and stakeholders.
Executives also benefit from clearer reporting and more accurate forecasting, allowing them to make informed strategic decisions.
Real Time Adaptability
In the past, project plans were often rigid and difficult to change. Modern Gantt charts are far more flexible.
If priorities shift or unexpected challenges arise, timelines can be updated instantly, with changes automatically reflected across related tasks and teams.
This adaptability is particularly important in industries such as technology and marketing, where projects often evolve rapidly.
Agile project management and Gantt charts, once considered incompatible, are now increasingly used together through flexible software platforms.
The Future of Gantt Charts
As artificial intelligence and automation continue to advance, Gantt charts will become even more intelligent and interactive.
Future developments may include:
- Voice controlled project updates
- Real time risk scoring
- Automated budget forecasting
- Assigning AI agents to tasks within the Gantt chart
Rather than replacing project managers, these tools are enhancing human decision making and reducing administrative burden.
Final Thoughts
In 2026, Gantt charts are no longer just planning tools. They are central command systems for modern project management.
Their ability to combine scheduling, collaboration, forecasting, and real time adaptability makes them indispensable in a fast moving business environment. As projects become increasingly complex, organisations that embrace smarter visual planning tools are likely to gain a significant advantage.
The humble Gantt chart has come a long way from its origins. Today, it is helping redefine how businesses organise work, manage teams, and deliver results in an increasingly digital world.
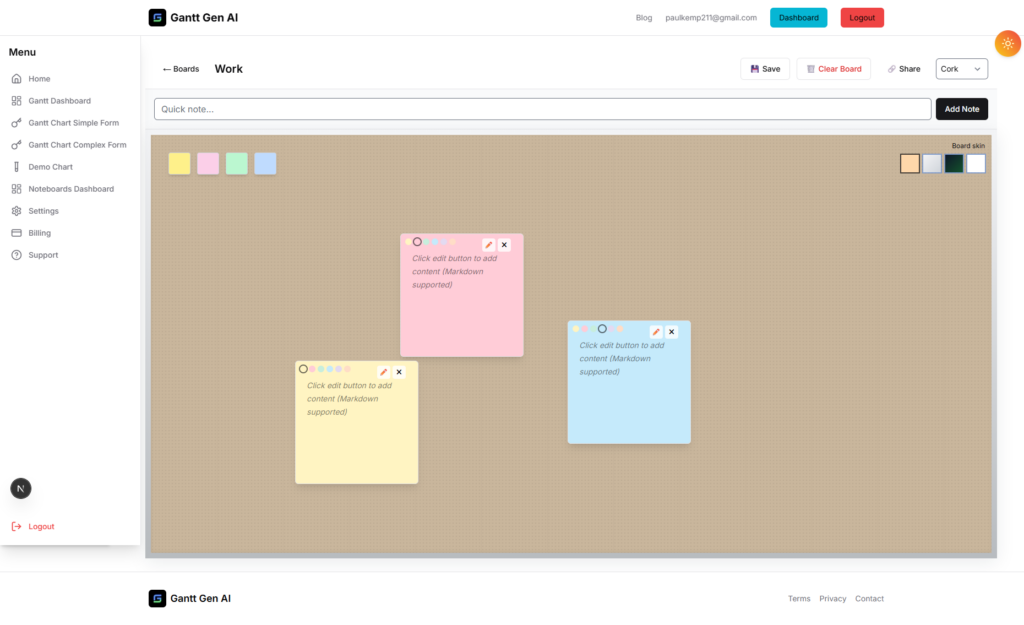
Check out GanntGenAI to learn more about the future of product management.